The Industry
A curated snapshot of Indonesia’s gas landscape, from reserves and policy signals to supply–demand and the full gas value chain. The figures and maps below reference official publications, with direct source links for quick verification.
Gas Reserves
Indonesia’s total 3P gas reserves are shown in the official reserves map (Ditjen Migas, Statistik Migas Semester I 2024). The map highlights national totals and regional distribution, to see where supply potential concentrates.
Total Gas Reserves (3P): 54.76 TCF
Breakdown (from the map): P1 35.30 TCF | P2 10.08 TCF | P3 9.36 TCF. Note: The map reports values in BSCF; conversion used here is 1 TCF = 1,000 BSCF.
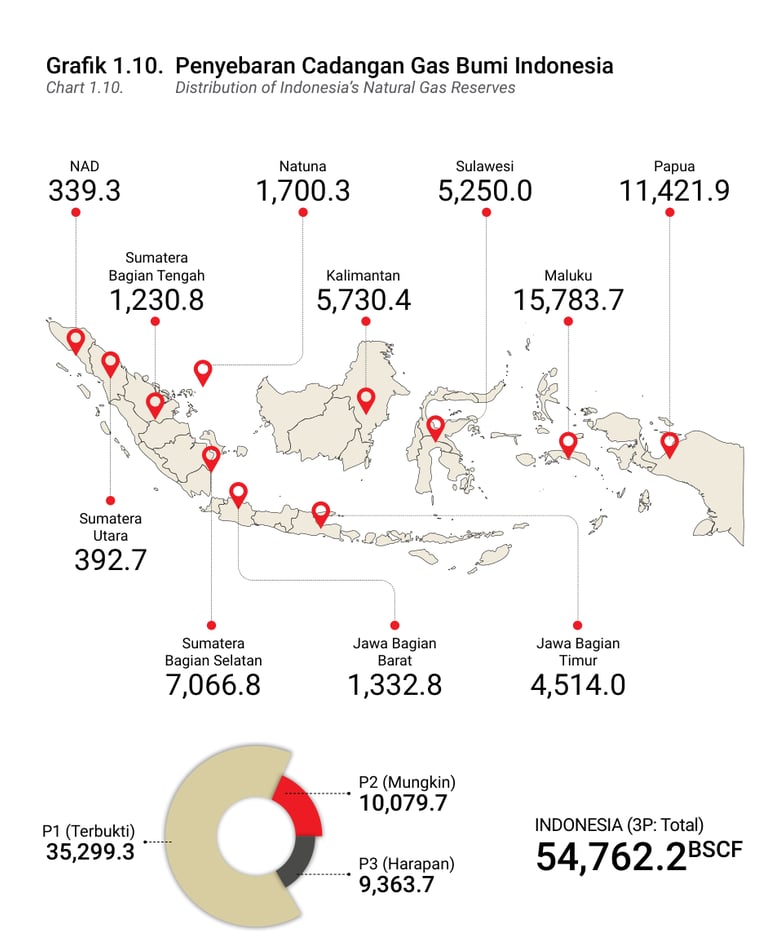
Source: Statistik Migas Semester I 2024 (PDF)(Reserves map, p.27).
Gas Status
Indonesia’s gas system has pivoted to a domestic-first market prioritizing reliability for industry, power, and city-gas while preparing selective LNG imports to close regional gaps. The latest official statistics provide a quick view of operational performance, including gas lifting and gas utilization. These snapshots help contextualize how domestic demand, exports, and infrastructure capacity interact.
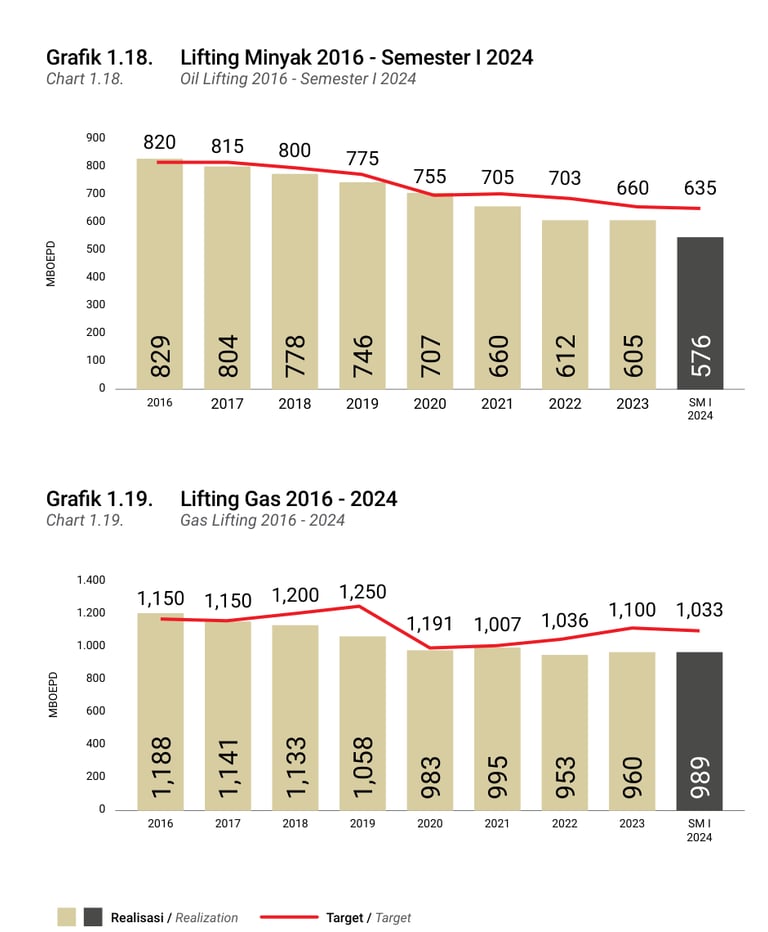
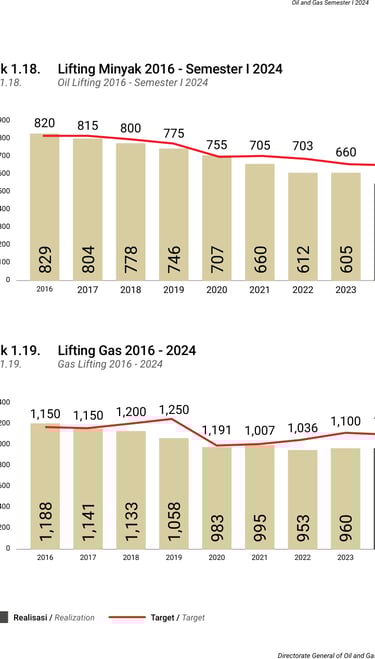
Source: Statistik Migas Semester I 2024 (PDF)(Gas Lifting, p.43).
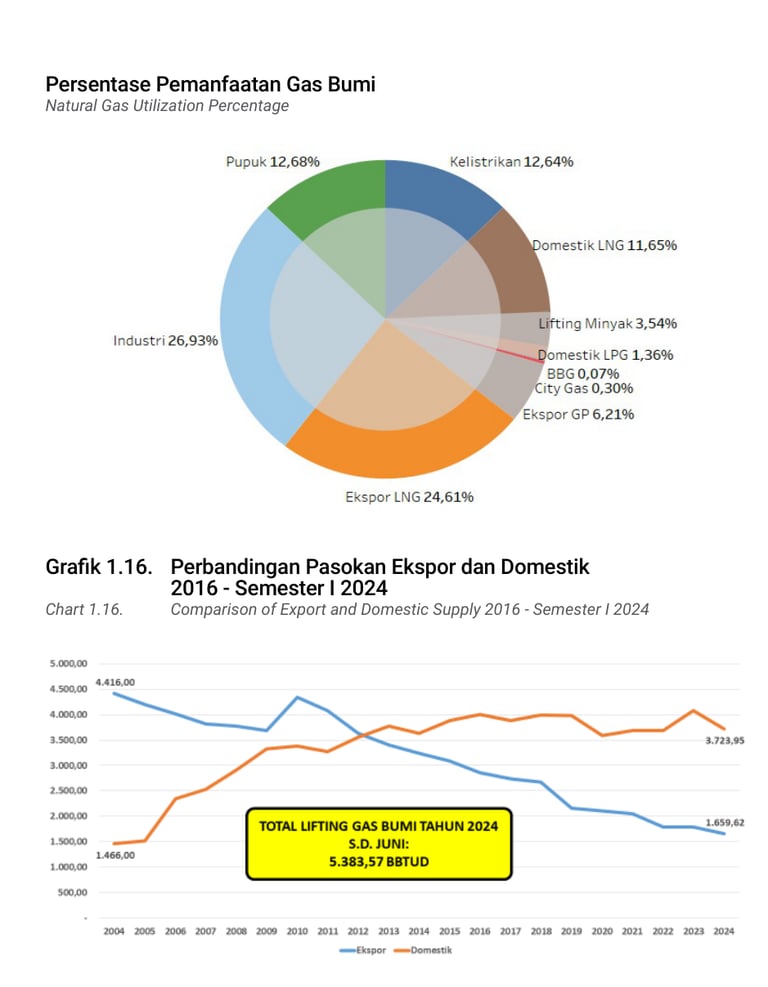
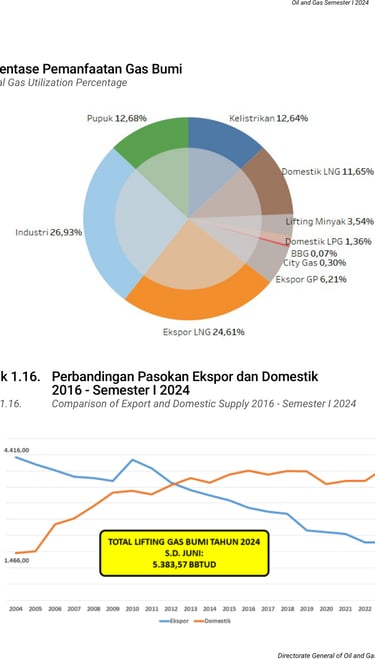
Source: Statistik Migas Semester I 2024 (PDF)(Gas Utilization, p.37).
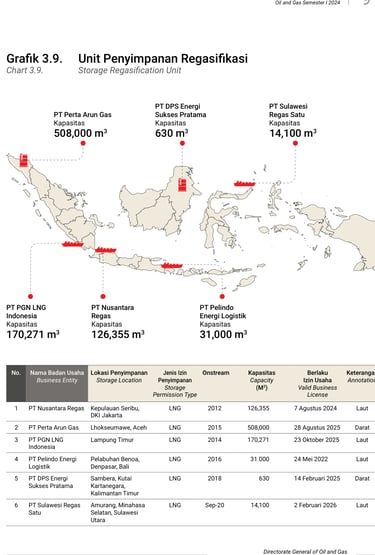
LNG Supply & Demand
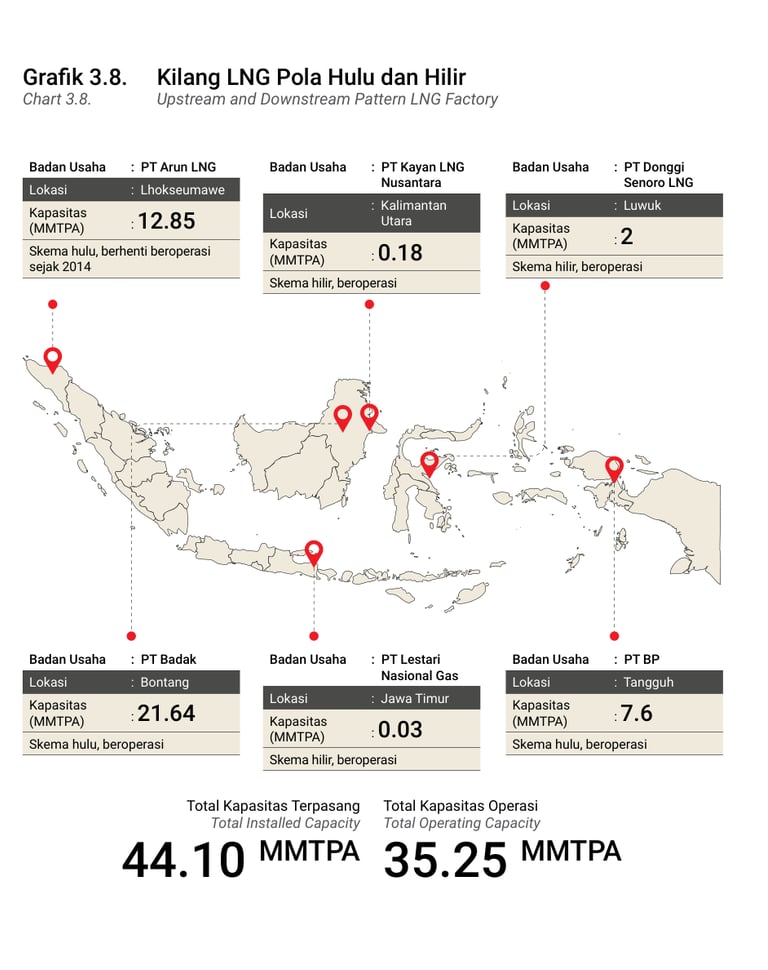
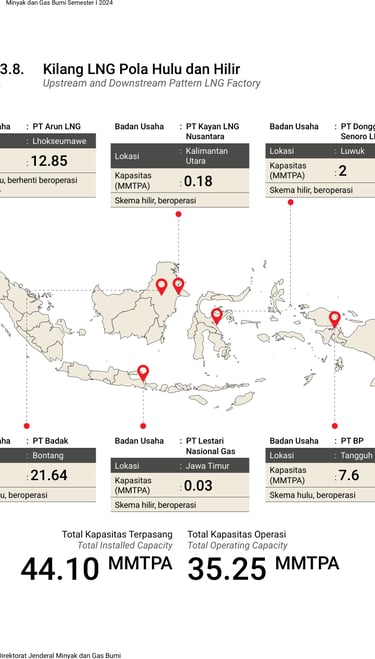
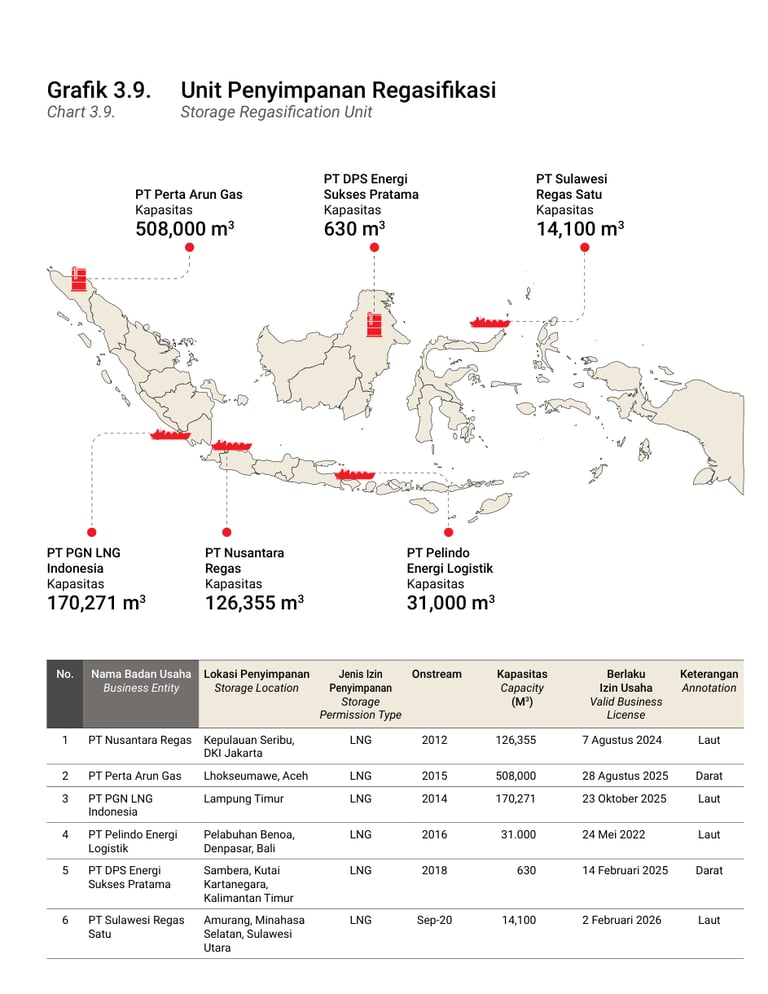
Supply–demand balance is shaped by upstream performance, LNG liquefaction output, domestic market obligations, and midstream readiness. LNG production and facilities maps below highlight where liquefaction capacity sits, while utilization patterns show where gas is consumed.
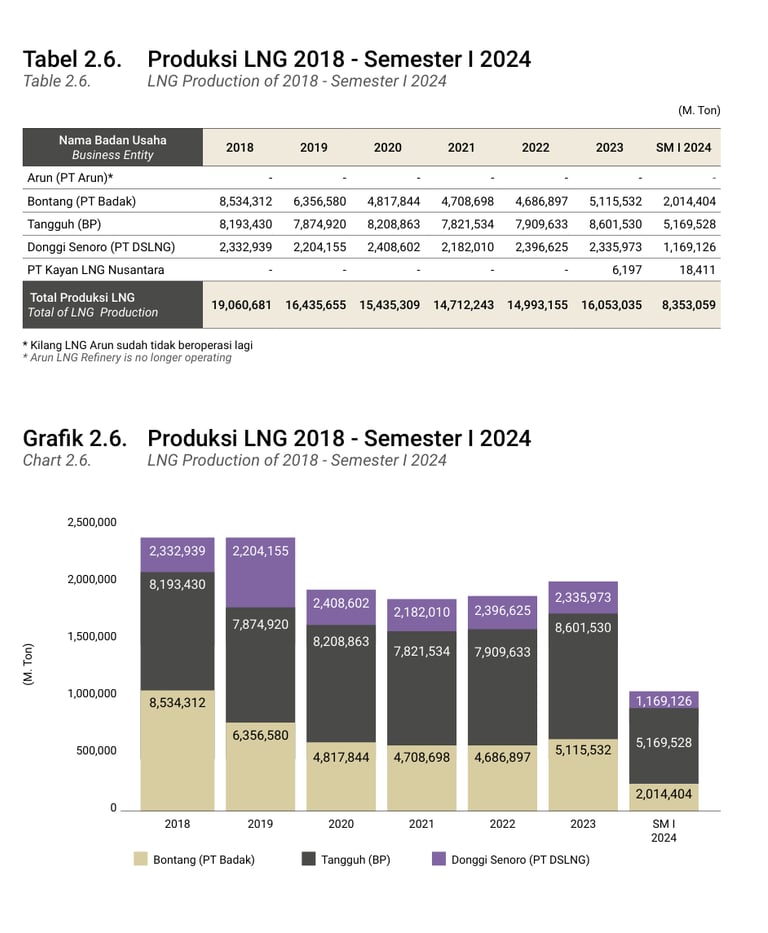
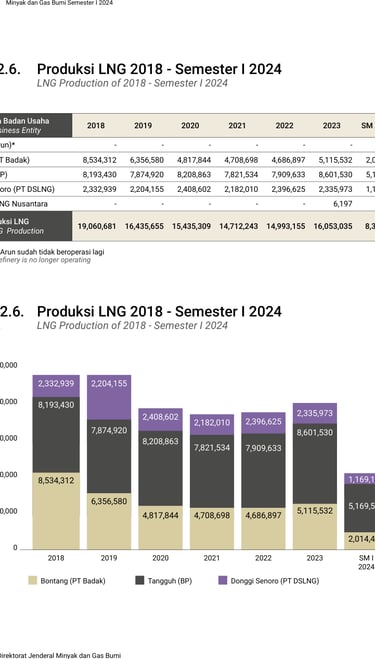
Source: Statistik Migas Semester I 2024 (PDF)(LNG Production, p.58).
Source: Statistik Migas Semester I 2024 (PDF)(Gas Storage Units Map, p.91).
Source: Statistik Migas Semester I 2024 (PDF)(Gas Facilities Map, p.90).
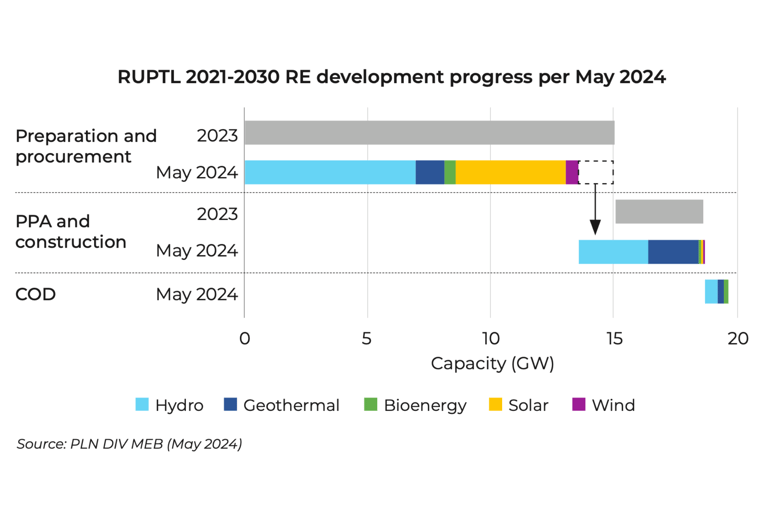
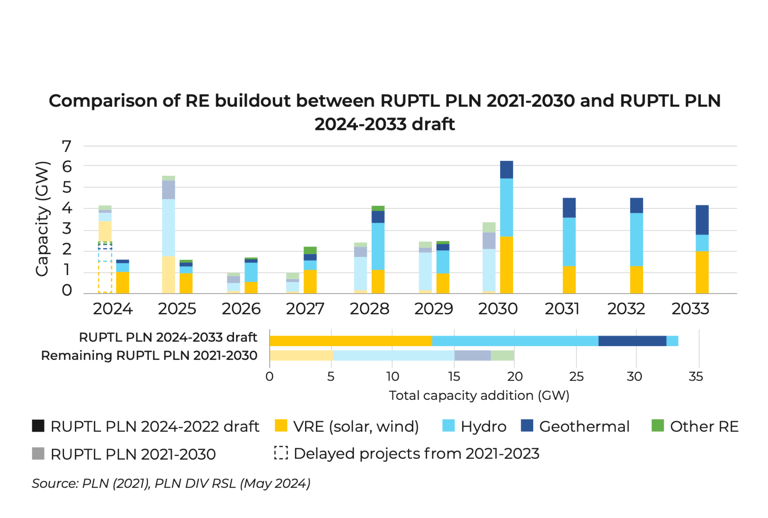
Source: Indonesia Energy Transition Outlook (IETO) 2025.( p.46).
>
The Industry
Rasuna Office Park, 3rd Floor Unit TO-05
Complex Rasuna Epicentrum
Jl. HR. Rasuna Said, Kuningan, Jakarta 12960
Tel : +62 21 8378 3757, 8379 5203
Fax : +62 21 8378 1126, 8379 5302
Email : secretariat@indonesiangassociety.com
© 2014. Indonesian Gas Society. All rights reserved.